Build a clearer view,
one question at a time.
Start with the question you need to answer. These seven member tools help you check market conditions, study a chart, and find ideas worth researching. Every paid tier includes the same toolkit.
Member quickstart
Pick your first question.
How is the market holding up?
Open Market Health. Read the condition summary and check the dates before digging into the signals.
What is this stock doing?
Open Charting Desk. Start with a company you know, then compare its trend, risk line, and data status.
What deserves more research?
Use the screeners and filing tools below to build a short watchlist. Open the underlying filing or event and look for the reason the idea could fail.
The Market Meter in the site header is free for every visitor. It gives a quick market reading and a short explanation. Paid members can open Market Health for the signals, source dates, and pullback research behind the reading. A score describes conditions; it does not predict the exact market top or guarantee a safe exit.
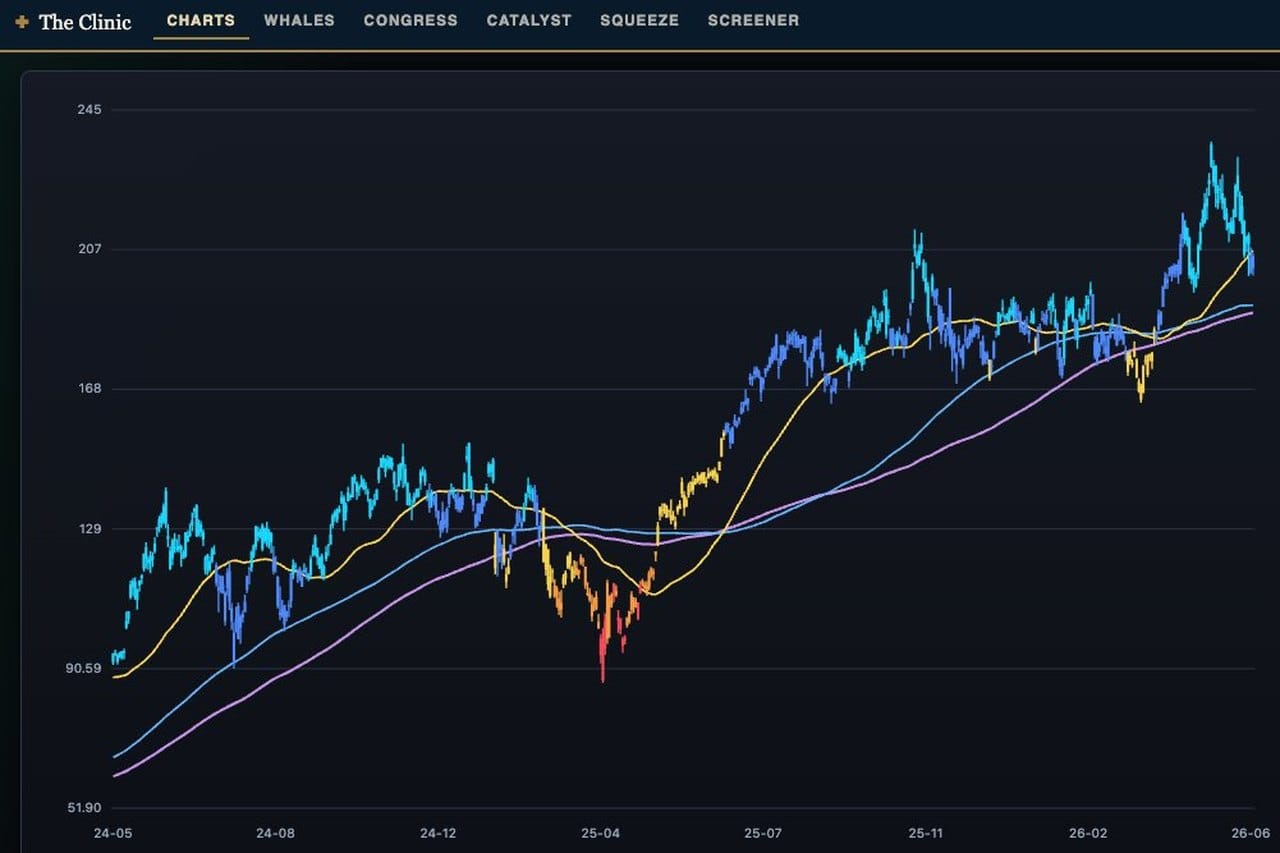
The Charting Desk
What does the chart say about trend and risk?
Study price trends, model setup flags, and risk levels in one place. The sizing lab uses the limits you enter for research; a setup flag is not a buy instruction. The separate Market Health page explains the wider market backdrop.
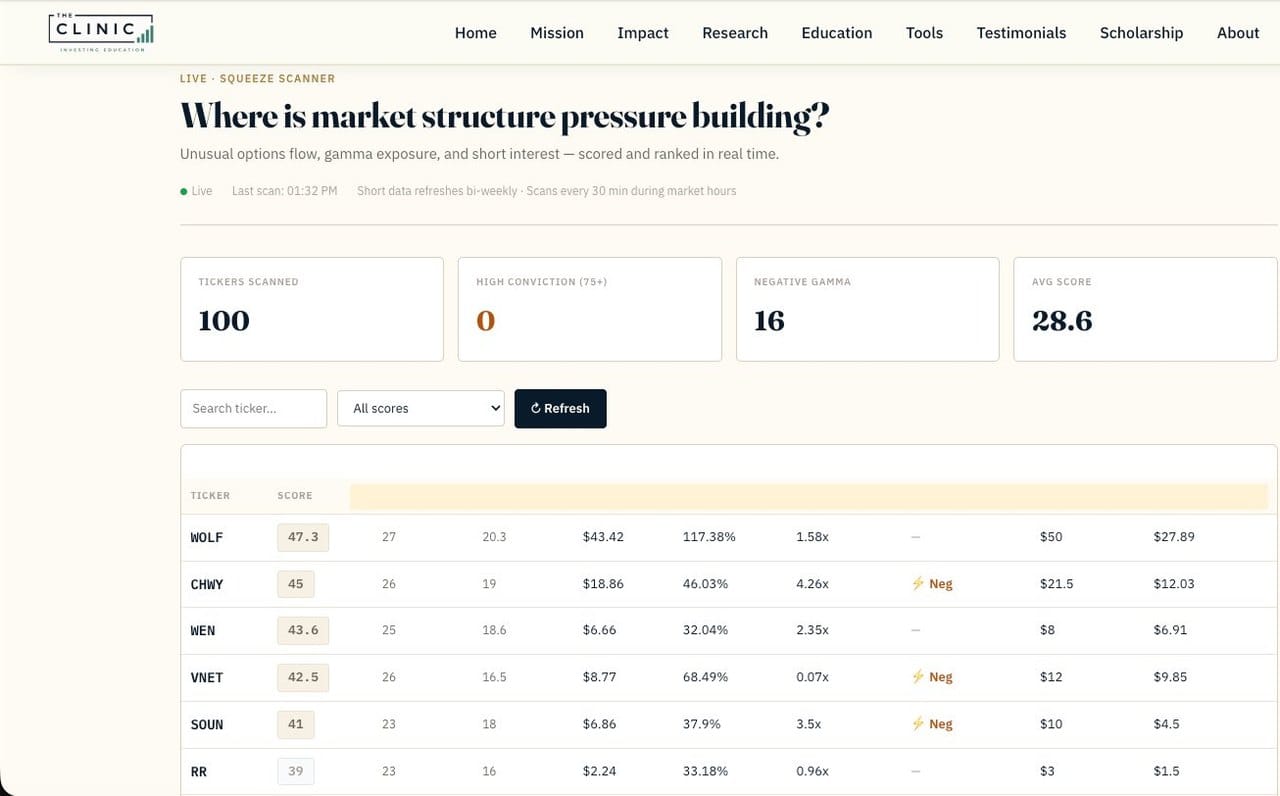
Squeeze Scanner
Where is pressure building?
Surfaces possible short-squeeze candidates using the available short-interest and options-related inputs. A high model score is a research lead. Check each input date, missing fields, and liquidity before drawing a conclusion.
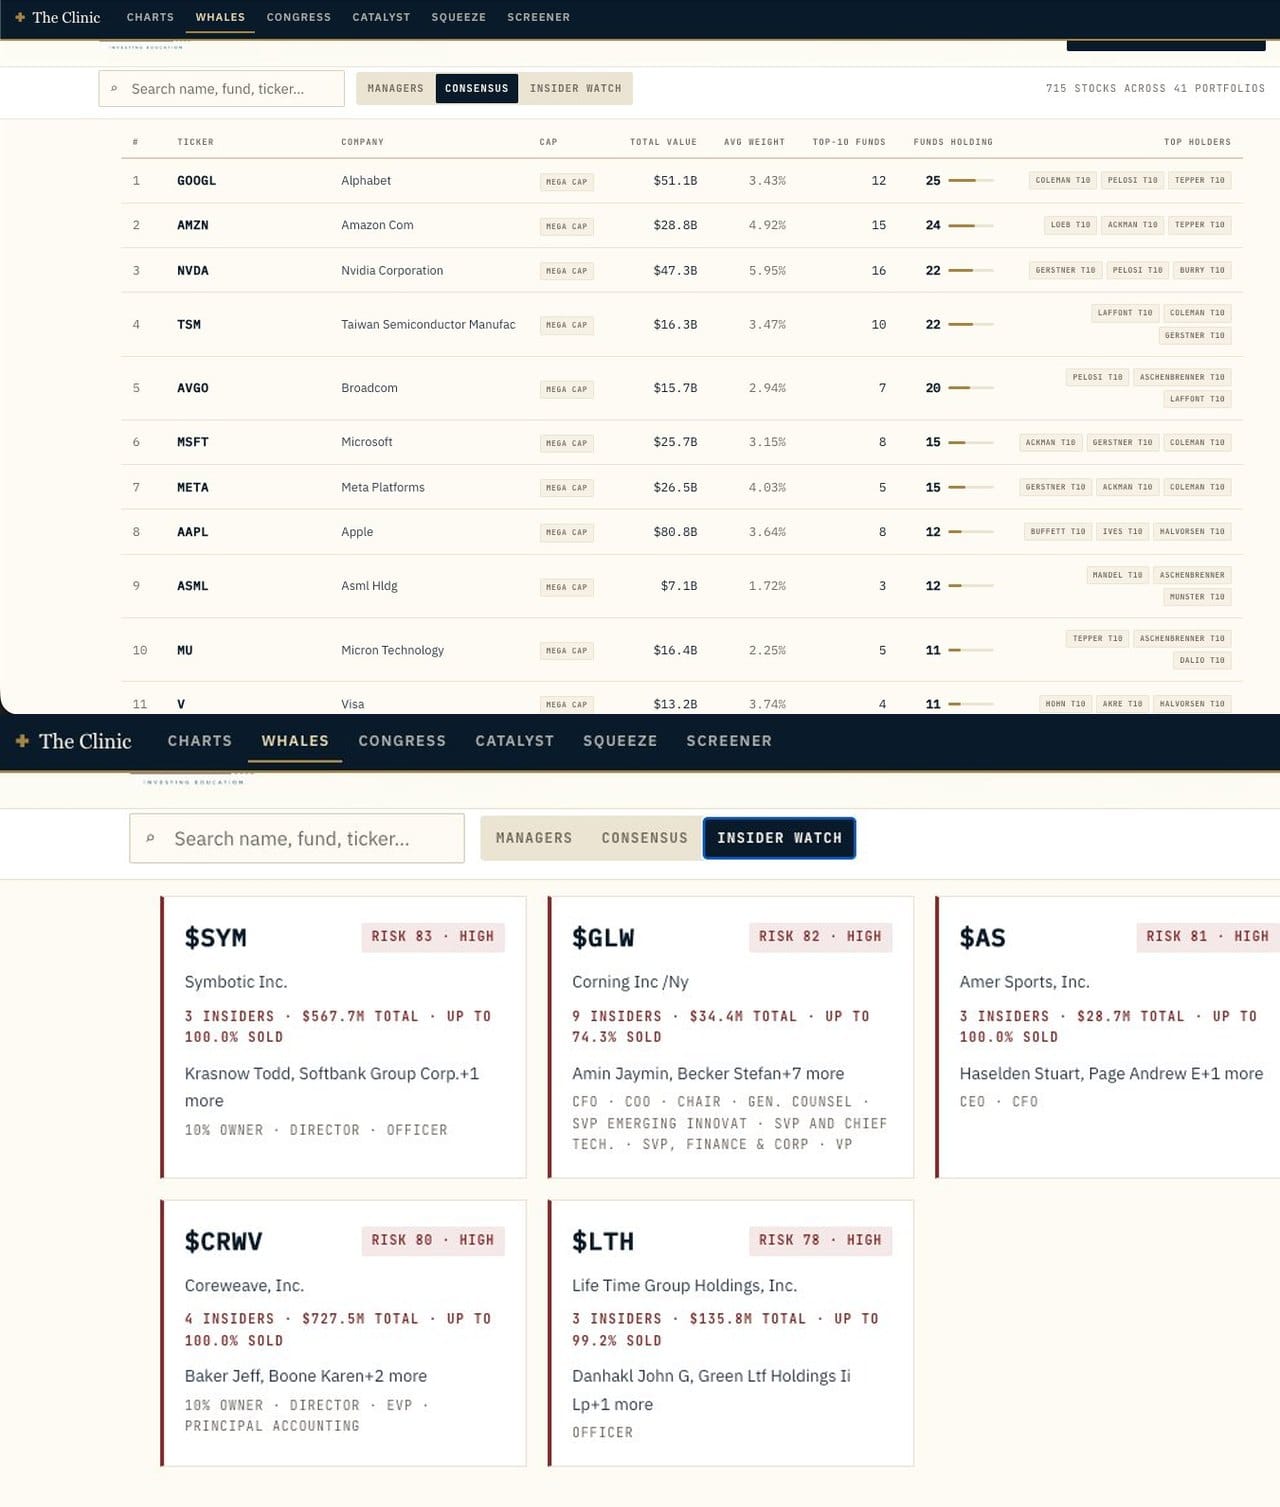
Whale Watch
What did funds report owning?
Compare reported fund holdings and insider disclosures. A filing is a dated record, not a live view of a portfolio. The manager may have changed a position before the filing became public.
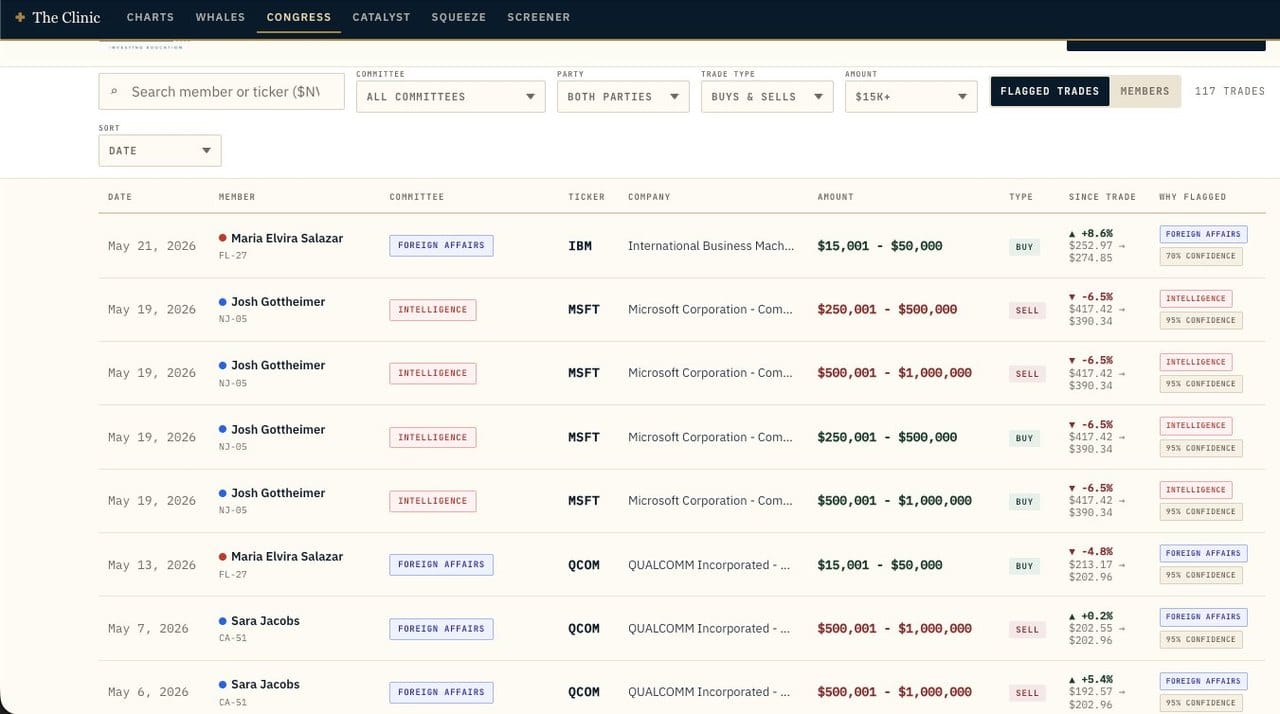
Congress Watch
What do public officials report trading?
Review reported trades alongside committee assignments. Disclosures can arrive after the trade and may show value ranges rather than exact amounts. A flagged connection is a reason to investigate, not evidence of wrongdoing.
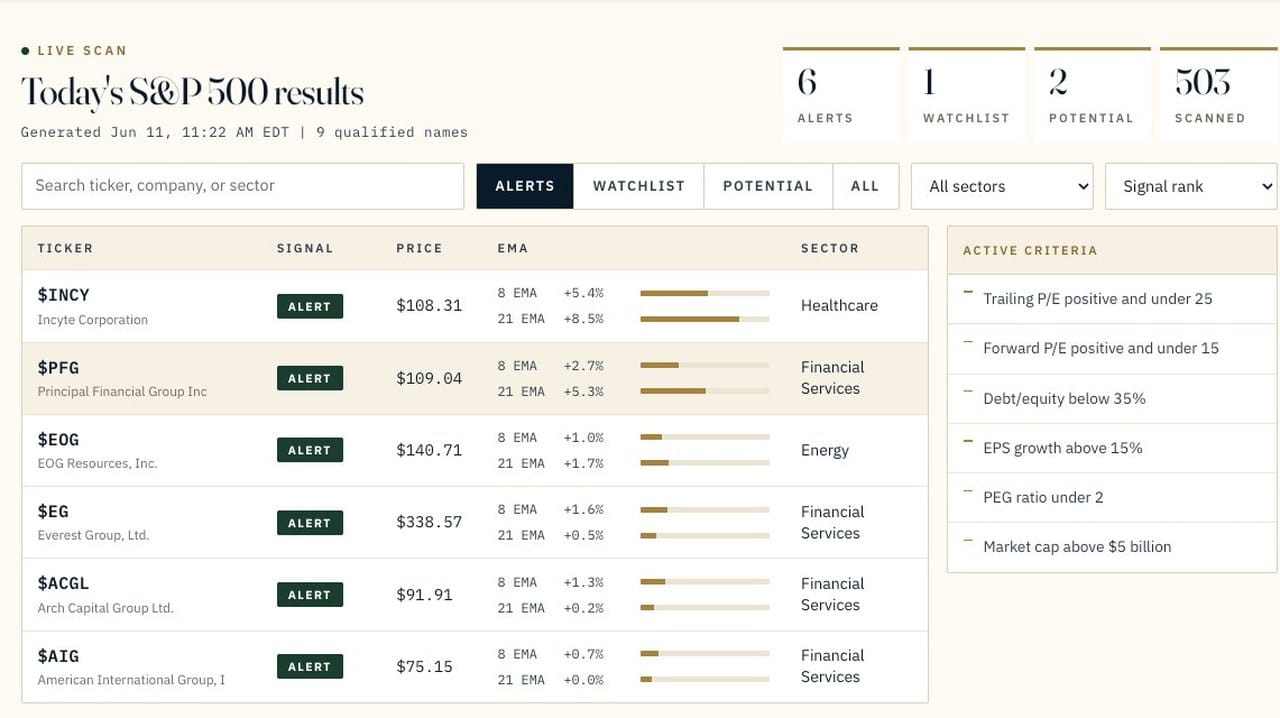
Peter Lynch Screener
Where are the value plays hiding?
Built on Lynch's principles. Filters for boring businesses with strong fundamentals, fair valuations, and quiet compounders. The person who turns over the most rocks wins.
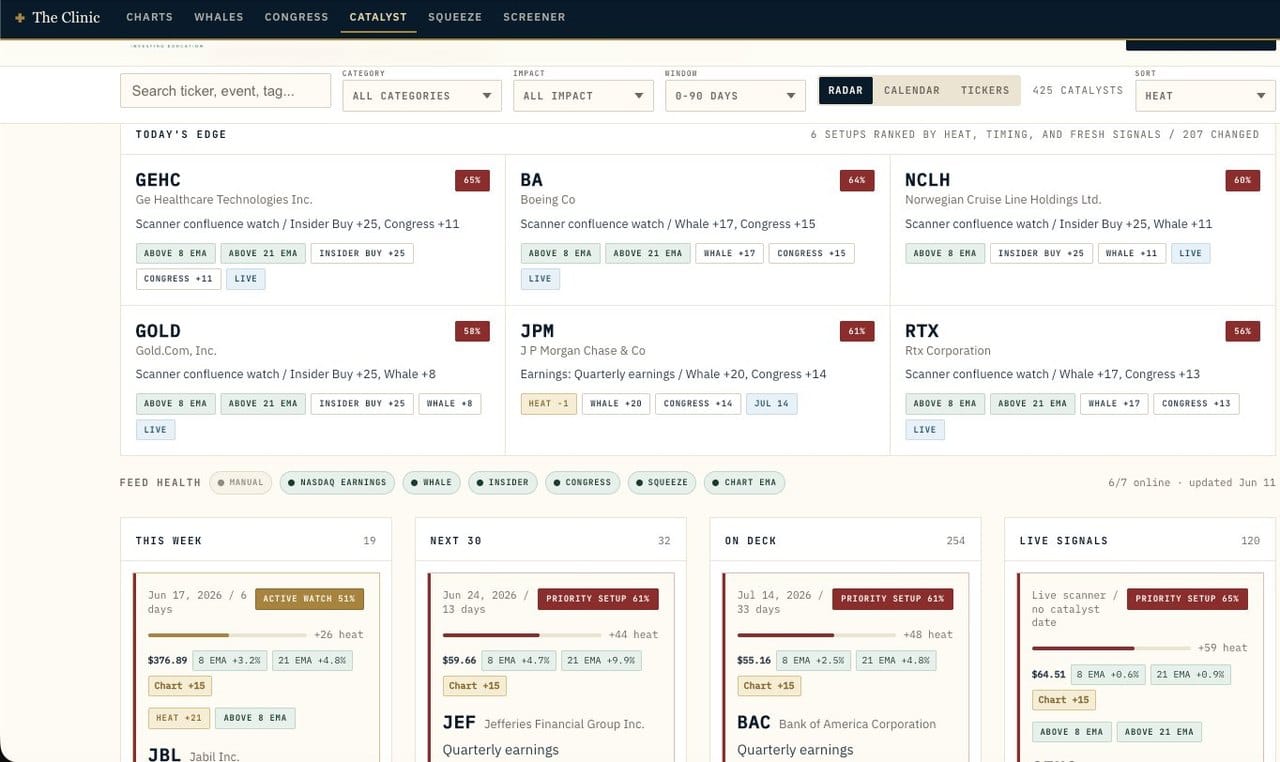
Catalyst Radar
What is about to move, and why?
Find scheduled events and other developments that may change a company's outlook. Read the event date and supporting evidence. An event can be postponed, priced in, or followed by a move in either direction.
Market Health
What is supporting the market, and what is weakening?
Read the daily Market Meter explanation, its component signals, and longer-term pullback research. Check the source dates and missing-data notes. Unknown inputs stay uncertain; a score is not a measured probability of a market top.
More tools in development
100% of membership profit after expenses goes to kids and schools in our community.
We think that is the highest-return investment there is. When you join, your tools sharpen your investing and your dollars help a kid.
Build a research routine you can repeat.
Every paid tier includes these seven tools. Research and Discord benefits vary by tier. When you return, check what changed in Market Health, revisit one company on your watchlist, and write down what would change your view.
Cancel anytime. Profits fund kids and schools.
Before you act
Keep the source and the date in view.
Tool scores help organize evidence. They do not know your full portfolio, and they cannot guarantee a profitable trade. Before acting, verify prices with your broker and compare the idea with your own cash, allocation, and risk limits.